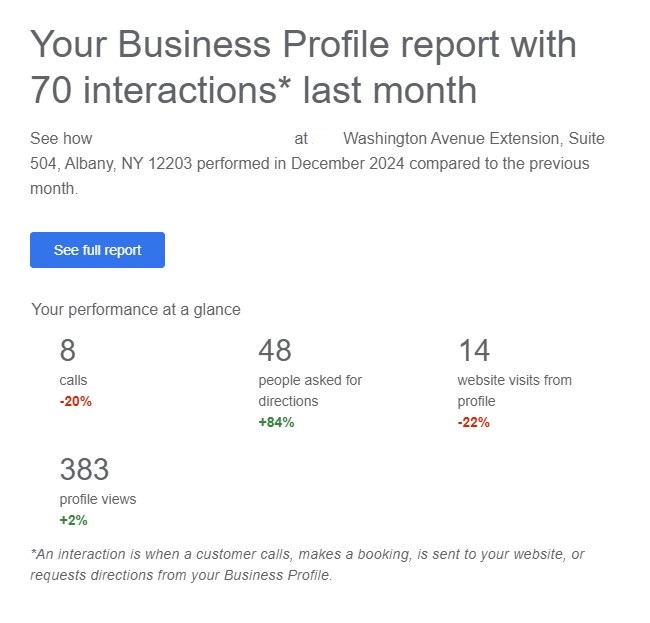
Those monthly emails from Google about your Google Business Profile (GBP) performance can be incredibly misleading—and they’re confusing a lot of people. They often look something like this:

What’s interesting is that people misinterpret them in opposite ways. Some clients call us excited, convinced that the email shows they’re suddenly dominating the competition. Others call us in a panic, saying, “Google says you’re doing a terrible job this month!”
The truth? These emails don’t actually tell you either of those things.
Your GBP Email Only Tells Part of the Story
Google’s summary email only reports on your GBP performance and only compares this month to last month. That means:
- It doesn’t reflect your overall web presence
- It says nothing about your rankings in search results
- It doesn’t include any paid ads (PPC) performance
- It doesn’t tell you how your GBP is performing in absolute terms
It’s like checking today’s temperature and assuming that’s the climate trend for the entire year. It’s just a tiny snapshot, not the big picture.
Absolute vs. Relative Performance: Why Comparing to Last Month Is Misleading
Because the email only compares your performance to the previous month, some very basic factors can completely distort your understanding of reality.
Here are a few common scenarios:
Scenario 1: A Temporary Spike Makes a Normal Month Look Bad
If your performance spiked last month and returned to normal this month, the report will say you’re “underperforming.” But in reality, you’re just back to your usual numbers.
Common Causes: Seasonality, a temporary surge in interest, or major events like hurricanes (depending on your industry).

Scenario 2: A Temporary Drop Makes a Normal Month Look Great
If your performance dipped last month and has now recovered to average, the report will say you’re “crushing it.” But in reality, you’re just back to where you should be.
Common Causes: Seasonality, holidays, vacations, weather events, or changes in PPC spending.
Scenario 3: A Huge Spike Followed by a Drop That’s Still Above Average
If your performance spikes way up and then drops—but still remains above your usual numbers—the email will say your performance is “tanking.” But in reality, you’re still doing better than average!
Example: Your second-best month ever might look “bad” just because last month was your best ever.

Focus on Trends, Not One-Off Reports
No marketing campaign moves in a perfectly straight line. Your efforts change, your competitors adjust their strategies, and Google is constantly tweaking its algorithm. The entire digital landscape is always shifting.
This means your performance graphs will always show a saw-tooth pattern with ups and downs, rather than a smooth trend. What really matters is that when you zoom out, the overall trend is moving in the right direction.
Instead of worrying about month-to-month fluctuations, track your rolling average over time. This will give you a clearer, more accurate picture of your long-term growth.
Final Takeaway: Watch the Trend, Not a Single Month
Rather than stressing over Google’s month-to-month reports, ask yourself:
- Am I seeing overall growth over the past 6–12 months?
- Am I receiving more calls and emails from real people interested in my services?
- Are my rankings trending upward in search results?
- Are my leads and conversions increasing over time?
A single month-over-month report of just one small piece of your marketing efforts tells you almost nothing.
Stay focused on the bigger picture, and don’t let one email shake your confidence!


